skip to main | skip to sidebar

Monday, December 8, 2008

Cadastral Map


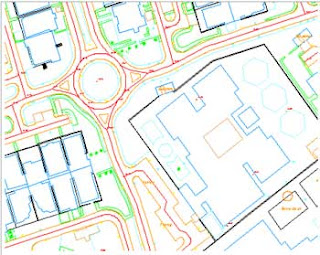
This map is not very detailed or descriptive, but it is nevertheless showing ownership of different parts of a city or area. Probably, the blue areas are commercially owned, where the red areas seem to be streets or other state owned highways. Green could represent peoples private property or individual businesses.


http://www.gisdevelopment.net/technology/gis/images/me05137.jpg
Posted by rls05g at 3:56 PM

No comments:

Post a Comment

Newer Post Older Post Home
Subscribe to: Post Comments (Atom)

Maps Maps Maps

Blog Archive

  • ▼  2008 (51)
    • ▼  December (50)
      • Star plot
      • Correlation Matrix
      • Similarity Matrix
      • Stem and Leaf Plot
      • Box plot
      • Histogram
      • Parallel Coordinate Graph
      • Triangular plots
      • Windrose
      • Climograph
      • Population Profile
      • Scatterplot
      • Index Value Plot
      • Lorenz curve
      • Bilateral Graph
      • Nominal Area Choropleth Map
      • Unstandardized Choropleth Map
      • Standardized Choropleth Map
      • Univariate choroplath map
      • Bivariate choropleth map
      • Range graded proportional circle map
      • Continuously variable proportional circle map
      • DOQQ
      • DEM
      • DRG Map
      • Isopleth
      • Isopachs
      • Isohyets
      • Isotach
      • Isobars
      • LIDAR
      • Doppler Radar
      • Black and White Aerial Photo
      • Infrared Aerial Photo
      • Cartographic Animation
      • Statistical Map
      • Cartogram
      • Flow Map
      • Isoline Map
      • Proportional Circle Map
      • Choropleth Map
      • Dot Distribution Map
      • Propaganda Map
      • Hypsometric Map
      • PLSS Map
      • Cadastral Map
      • Thematic Map
      • Topographic Map
      • Planimetric Map
      • Mental Map
    • ►  October (1)

About Me

rls05g
View my complete profile