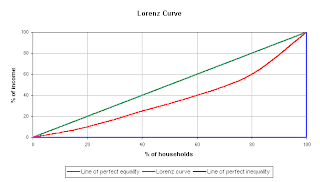
 This is a lorenz curve. It is comparing the actual data to the equal distribution line. The green line is the perfect equal distribution and the red is the actual data.
http://content.answers.com/main/content/wp/en/b/bd/Lorenz-curve1.png
 This is a lorenz curve. It is comparing the actual data to the equal distribution line. The green line is the perfect equal distribution and the red is the actual data.
No comments:
Post a Comment