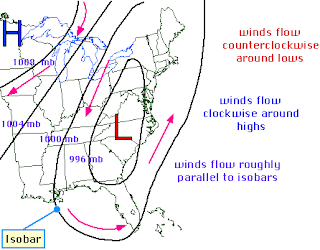
This map shows isobars over the Northeastern part of the united states. It is showing the pressure differences throughout the region and the high and low (H and L) pressures.
http://ww2010.atmos.uiuc.edu/guides/maps/sfcobs/cntr/gifs/wind1.gif
http://ww2010.atmos.uiuc.edu/guides/maps/sfcobs/cntr/gifs/wind1.gif
No comments:
Post a Comment