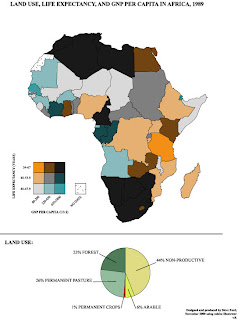
 This map is a Bivariate choroplath map and pie chart of the land use, life expectancy, and GNP per capita in Afica 1989. It is simply bivariate because there are two variables, land use and life expetancy.
http://www.geocities.com/stevejford/Africa_Choropleth.jpg
No comments:
Post a Comment